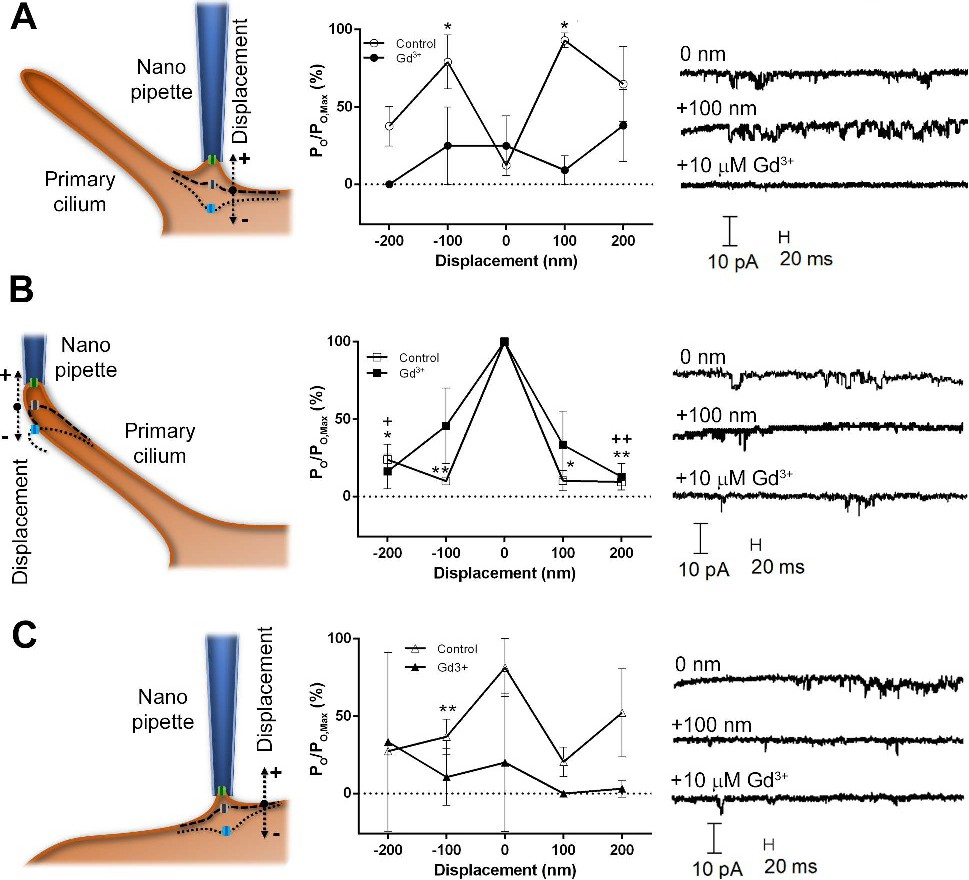
Fig. 3. Mapping mechano-sensitivity of ion channels at cilia base (A), cilia tip (B) and extra-ciliary regions (C). The left panels illustrate the displacement, the middle panels show the effect of the displacement on the mean normalised open probability Po of channels at pipette potential of -140 mV, and the right panels show example single-channel recordings. All values are shown as mean ± S.E.M (n=5 at cilia base, n = 3 at cilia tip, n = 5 at extra-ciliary regions. Significant differences with respect to zero displacement under control conditions (absence of Gd3+) are marked as *p<0.05 and ** p<0.01 (open symbols). Significant differences with respect to zero displacement in presence of Gd3+ are shown as +p<0.05 and ++p<0.01 (closed symbols).